Poster: Expecting more from your EM software
It seems that a discussion on trend analysis for environmental monitoring was just what the 2023 PDA Pharmaceutical Microbiology conference needed. Conversations were sparked in many different ways throughout the event; as environmental monitoring (EM) and trending was debated during plenary sessions, early morning interest group meetings and several poster presentations that were on display in Independence Hall.
I can speak most authoritatively on the discussions held at my own poster collaboration, titled ‘Expecting More from your EM Software: Reliable and Effective Trend Analysis’. It’s my strong belief that systems (equipment, training, software, etc.) should be developed in support of the science and not the other way around. So, I envisioned my poster would describe the ideal EM trending program. If you have experience in environmental monitoring, then you know that it’s not a perfect science. In fact, environmental monitoring is a rather imprecise and reactionary science, one that depends largely on big volumes of data to become statistically meaningful.
It was evident that this topic resonated with people too, as traffic to the poster was fantastic. Made me curious why the visuals in the poster were so alluring, it’s almost like they told a story. A story about demonstrating environmental control and displaying trend requirements in a way that is compliant and interesting but also adding value to the quality system. Environmental monitoring on its best day, should tell us a really good story about whether or not the classified areas are in a state of control.
Much like a well written investigation, we need our EM story to be true, to be accurate, and of course, easy to read. This is best accomplished when we consider the audience of our trend analysis, which is most often quality and operations leadership, as well as regulators, clients (in the case of CDMO operations) and other potential stakeholders. Considering all of these parameters, the best told story for EM trending must include the following three elements: a quantitative analysis, a qualitative analysis, and meaningful visuals to superimpose the first two elements onto a cleanroom map.
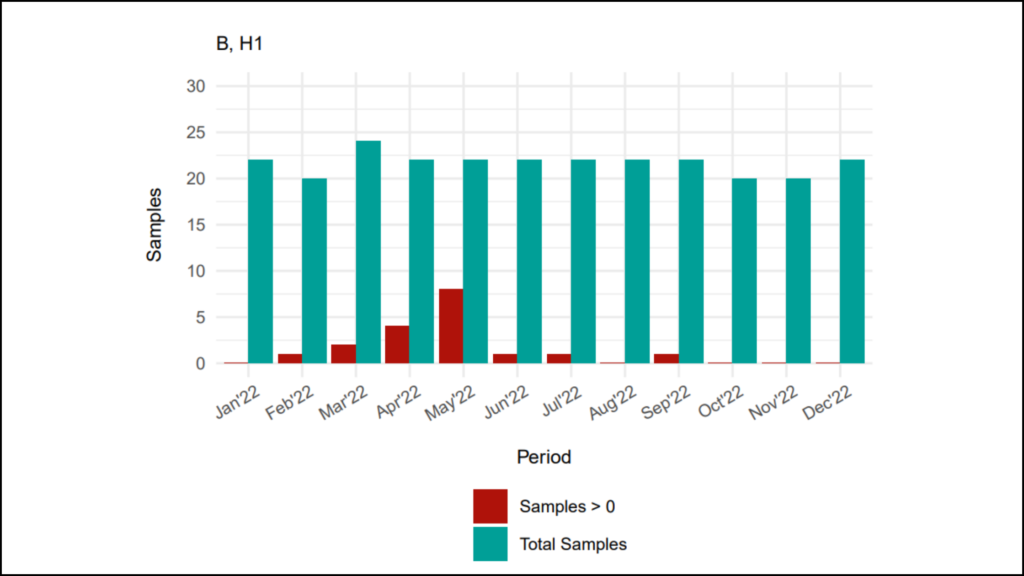
The quantitative analysis is what we most commonly see in the form of excursions rates, which can be at the individual event for an alert or action level excursions, or it can be contamination recovery rates (CRR) analyzed for all growth recovered in one month’s time. Quarterly and Annual trending for excursion rates and CRR also apply.
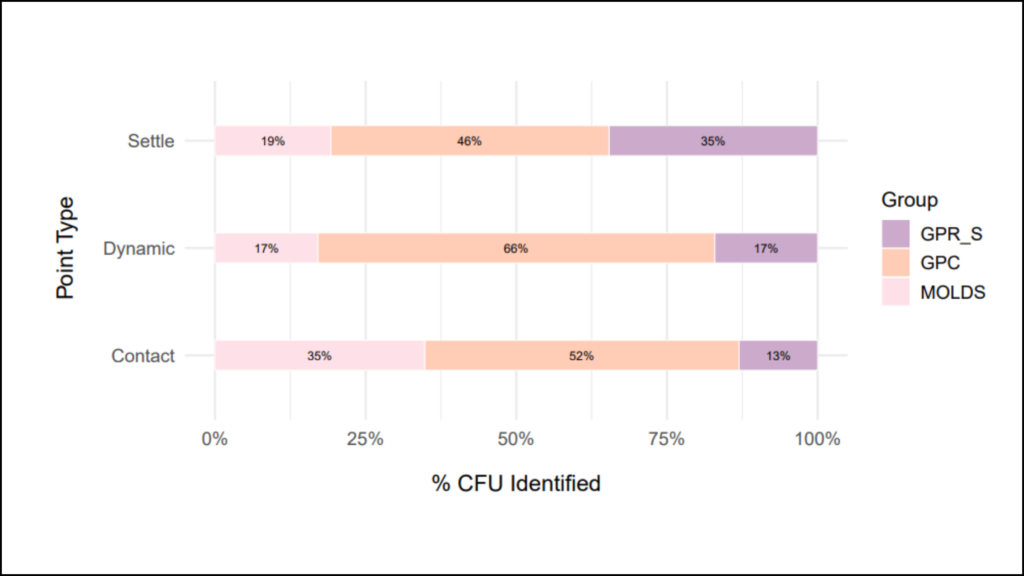
The qualitative analysis provides technical insight to the types (or quality) of microbes found in the cleanroom, regardless of how many were found. The purpose of this perspective is to evaluate the presence of certain organisms that may pose a threat to the manufacturing process (think mold, pathogenic organisms, or spore forming bacteria).
Sounds like a good story so far, but what about our visuals? Graphs, pie charts and other figures are important, but imagine if we could provide a picture that displays both the quantity (how many), with the frequency of recovery (how often), as well as the type (what kind) of microbe- in the actual physical location where it was recovered? That’s called a heat map. These are becoming more popular, and I can’t imagine a good EM story ending without including this type of map.
Our final piece to the story from the poster discussed how trending EM results could support the implementation of alert (and action) levels for viable surface or air samples. Several people were interested to see which methods are possible for establishing these levels, depending on the size of the dataset. Trending environmental data on an annual basis should include this evaluation because it can reveal yet another perspective on the state of control for our cleanrooms. Do the alert levels remain appropriate? Or are they too high, possibly too low and do we need a risk assessment to adjust them accordingly? These are the points to consider, and one can assess many different statistical tools such as the mean value, standard deviation, and percentiles to determine the right approach for setting these levels in routine operation.
So, the big question now is, what’s your EM trending story? Do you have the right tools to build it? Download the poster to learn more.

Vanessa Figueroa leverages her combined knowledge of the Pharmaceutical, Biotechnology and Medical Decives industries to provide manufacturers across the US, Europe and India with critical laboratory operations management and personnel training programs to ensure compliance with cGMPs as well as global regulatory standards.
Combining hands-on Quality Control, Sterility, Inspection, and Compliant Operations with an educational leadership approach and natural business acumen, Vanessa brings 17+ years of real-time experience to deliver transformational real-world results.